
Implementing AI-powered operational intelligence for proactive decision making
Learn how to build AI-powered operational intelligence systems that predict bottlenecks and optimise resource allocation before problems hit.
Key Takeaways
- AI-powered operational intelligence shifts CTOs from reactive firefighting to predicting bottlenecks before they happen.
- Predictive analytics requires synthesising data across CRM, ERP and infrastructure systems into unified intelligence platforms.
- Machine learning models trained on operational patterns enable resource optimisation and strategic decisions ahead of issues.
- Proactive decision-making delivers competitive advantage that traditional retrospective dashboards simply cannot provide.
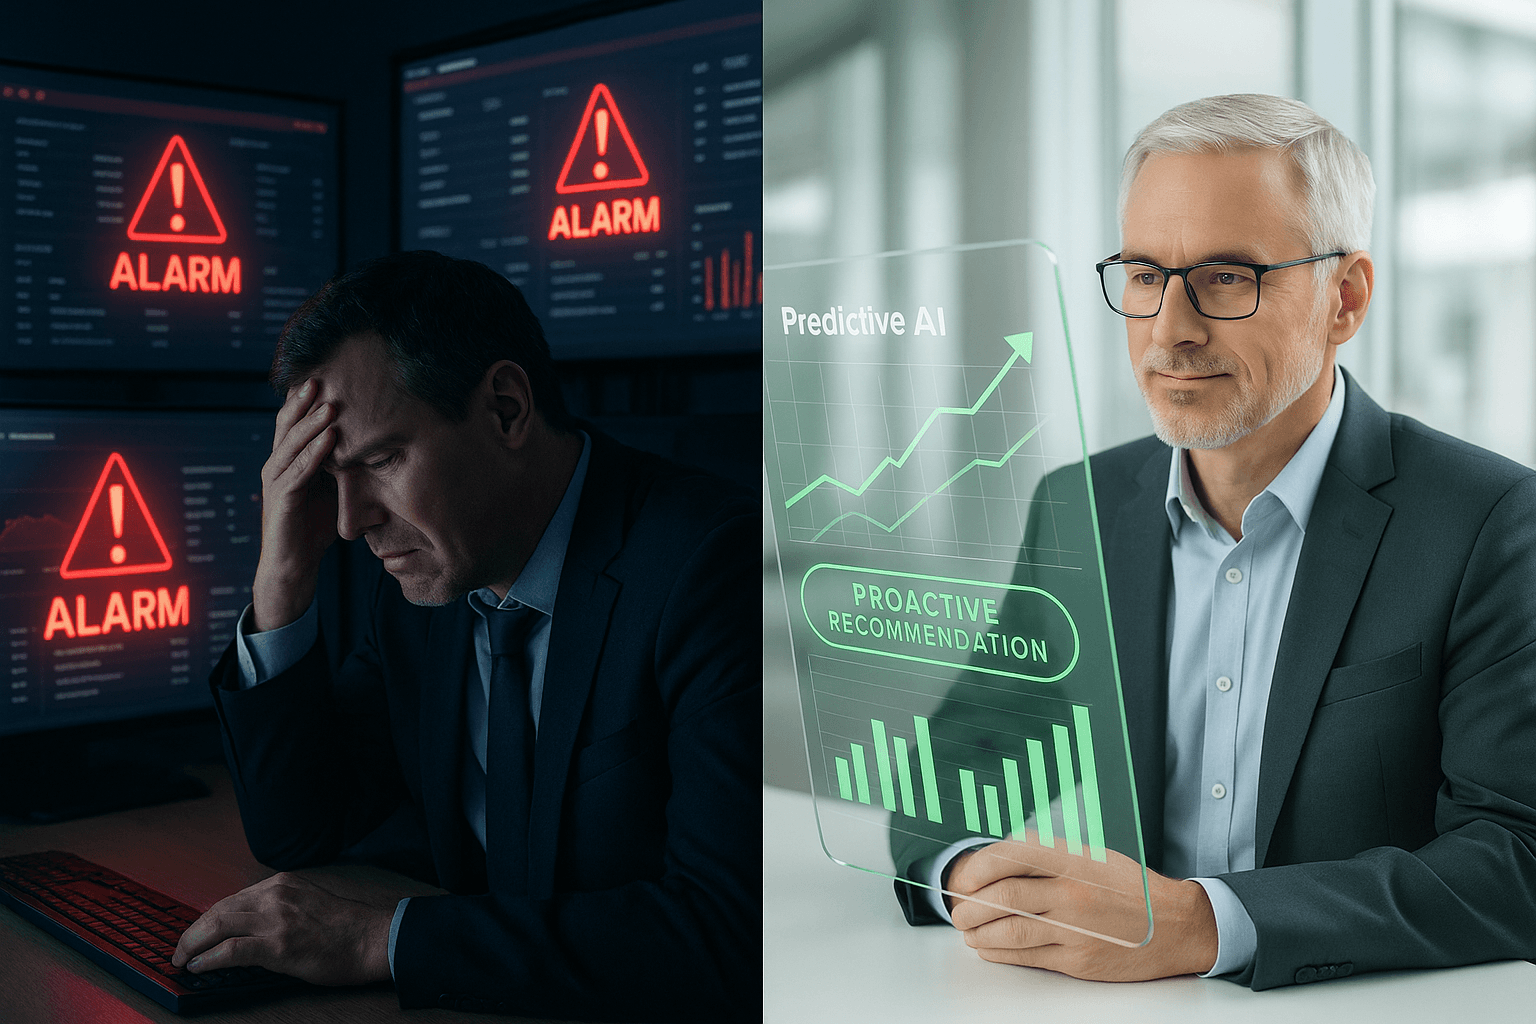
Most CTOs still operate in reactive mode, relying on dashboards that tell them what already happened. AI-powered operational intelligence changes that by predicting bottlenecks, resource constraints, and opportunities before they impact your business. This is how you build systems that let you act instead of respond.
Metadata
- Publish Date: 2026-08-31
- Pillar: Business Operations
Introduction
Your dashboards show you what already happened. By the time you spot the problem, you're already fighting fires.
AI-powered operational intelligence shifts this dynamic. Instead of reacting to issues after they surface, you predict them before they impact your business. This means catching infrastructure failures before they cascade, identifying revenue bottlenecks before they affect quarterly targets, and reallocating resources before teams hit capacity walls.
This post breaks down how to build and implement operational intelligence systems that synthesize data across your CRM, ERP, and IT infrastructure. You'll learn the technical architecture, data pipeline requirements, and machine learning models needed to turn raw operational data into predictions that drive action.
Why traditional monitoring fails ctos
Most enterprise operations run on retrospective reporting. Your team reviews last week's metrics, last month's revenue, yesterday's system performance. You're steering using the rearview mirror.
Three critical gaps emerge:
Delayed signal detection. You spot trends only after they've materialized into problems. Customer churn patterns appear in reports weeks after the behavioral shifts began. System degradation shows up in alerts after performance already declined.
Siloed data sources. Your sales data sits in Salesforce. Financial data lives in NetSuite. Infrastructure metrics flow through Datadog. Each system tells part of the story. None connect the dots.
Manual correlation. When issues arise, your team spends hours pulling data from multiple systems, building spreadsheets, and attempting to identify root causes. By the time you understand what happened, the opportunity to prevent it is long gone.
AI operational intelligence solves these problems by continuously analyzing data across all systems, identifying patterns humans miss, and flagging anomalies before they escalate.
The architecture of proactive intelligence
Building operational intelligence requires three core components: unified data ingestion, real-time processing, and predictive modeling.
Unified data layer
Start with a central data warehouse that ingests streams from all operational systems. This means connecting:
- CRM platforms (customer interactions, deal velocity, support tickets)
- ERP systems (financial transactions, inventory levels, procurement cycles)
- IT infrastructure (application performance, server health, network traffic)
- HR systems (team capacity, time allocation, hiring pipeline)
Use change data capture (CDC) to stream updates in near real-time. Traditional batch ETL processes create dangerous lag. An API throttling issue that starts affecting customers at 2pm won't show up in your overnight batch job until the next morning.
Tools like Fivetran, Airbyte, or custom Kafka pipelines handle the ingestion layer. Your data should land in a queryable warehouse (Snowflake, Databricks, BigQuery) within minutes of generation.
Real-time processing engine
Raw data means nothing. You need continuous analysis that spots deviations from normal patterns.
Build streaming analytics pipelines that:
- Calculate rolling metrics across time windows (hourly, daily, weekly baselines)
- Compare current values against historical distributions
- Flag statistical anomalies using Z-scores, interquartile ranges, or isolation forests
- Correlate events across different data sources
A spike in support tickets might seem routine. But when that spike correlates with a recent API deployment, increased database query times, and decreased conversion rates, you've identified a critical issue requiring immediate attention.
Apache Flink, Spark Streaming, or managed services like AWS Kinesis handle this processing layer. The key is maintaining state across streams so you can join and correlate events from different sources.
Predictive models
The real power comes from machine learning models trained on your historical operations data.
Deploy models that predict:
System failures: Train models on infrastructure metrics to predict when servers, databases, or services will hit resource limits or failure states. Look at CPU trends, memory growth patterns, disk I/O, and error rate progressions.
Revenue risks: Analyze deal velocity, customer engagement scores, product usage patterns, and support interaction trends to flag accounts at risk of churn or contraction months before renewal dates.
Capacity constraints: Model team productivity, project completion rates, and work queue depths to predict when teams will hit capacity walls. This gives you lead time to adjust roadmaps or hire.
Process bottlenecks: Identify where workflows slow down by analyzing cycle times, handoff delays, and approval durations. Predict which initiatives will miss deadlines based on current velocity.
Start with simple time-series models (ARIMA, Prophet) for baseline predictions. Graduate to gradient boosting (XGBoost, LightGBM) or neural networks (LSTMs, Transformers) for more complex pattern recognition across multivariate data.
Model accuracy matters less than directional signal. A prediction that's 70% accurate but gives you three weeks' warning beats a perfect retrospective view.
Implementation roadmap for ctos
Building this capability takes deliberate phasing. Trying to boil the ocean leads to failed projects.
Phase 1: Establish data foundations (weeks 1-8)
Pick three high-impact data sources. Don't try to connect everything at once. Choose systems where you have:
- Clean, reliable data
- Clear business problems to solve
- Executive sponsorship for access
Set up your data warehouse and ingestion pipelines for these three sources. Verify data quality, establish refresh frequencies, and build basic monitoring dashboards.
Assign a technical owner who understands both the source systems and your data infrastructure. This person becomes the bridge between engineering and business stakeholders.
Phase 2: Deploy baseline analytics (weeks 9-16)
Build streaming analytics on your initial data sources. Focus on obvious leading indicators:
- System health metrics that precede outages
- Customer behavior signals that correlate with churn
- Pipeline metrics that predict revenue shortfalls
Create alerting mechanisms that notify relevant teams when anomalies appear. Start with email or Slack notifications. Keep thresholds conservative to avoid alert fatigue.
Run these analytics in shadow mode initially. Track predictions against actual outcomes. Tune your models and thresholds based on feedback.
Phase 3: Add predictive models (weeks 17-24)
Train your first machine learning models on historical data. Start simple:
- Binary classification (will this account churn?)
- Time-to-event prediction (when will this system hit capacity?)
- Regression (what will revenue be next quarter?)
Deploy models that update predictions daily or hourly. Surface predictions through existing dashboards and communication channels.
Create feedback loops where teams mark predictions as accurate or inaccurate. Use this feedback to retrain and improve models monthly.
Phase 4: Scale and automate (weeks 25+)
Add more data sources. Expand to additional use cases. Build more sophisticated models.
Most importantly, move from alerts to automated responses. When the system predicts an infrastructure issue, automatically spin up additional capacity. When customer health scores drop, trigger outreach workflows. When project timelines slip, adjust resource allocations.
This transition from insight to action separates operational intelligence from fancy dashboards.
Common pitfalls that kill projects
CTOs attempting this transformation repeatedly hit the same roadblocks.
Data quality blindness. You assume source systems contain accurate, complete data. They don't. Bad data creates worse predictions than no predictions. Invest heavily in data validation and cleansing before building models.
Premature complexity. Teams jump straight to deep learning and complex ensemble models. Start with simple heuristics and statistical methods. Add complexity only when simple approaches fail.
Lack of business context. Engineers build technically impressive systems that don't solve real problems. Involve operations leaders, RevOps teams, and business stakeholders from day one. Build for their actual decision-making needs, not what you think they should want.
No feedback mechanisms. You deploy predictions with no way to validate accuracy. Create explicit workflows where users confirm or dispute predictions. Feed this back into model training.
Alert fatigue. Your system generates too many alerts, causing teams to ignore them all. Tune thresholds carefully. Better to miss 30% of issues than flood teams with false positives that train them to ignore all signals.
Measuring success beyond accuracy metrics
Model accuracy is a poor proxy for business value. A 95% accurate model that doesn't change behavior creates zero value.
Track these metrics instead:
Mean time to detection: How much earlier do you spot issues compared to traditional monitoring? You should be detecting problems hours or days before they would have appeared in standard dashboards.
Prevention rate: What percentage of predicted issues get resolved before they impact customers or revenue? Start tracking incidents that didn't happen because you took preventive action.
Decision velocity: How much faster do teams make operational decisions when armed with predictive insights? Measure time from signal detection to action taken.
Resource efficiency: Track saved engineering hours, reduced infrastructure costs, and improved team capacity utilization. These should show measurable improvement within six months.
Revenue impact: Quantify the dollar value of churn prevention, upside capture, and avoided downtime. This builds the business case for continued investment.
The path forward
AI operational intelligence represents a fundamental shift in how technical organizations operate. You move from reactive fire-fighting to proactive management. From gut-feel decisions to data-informed strategy. From siloed information to unified operational understanding.
The competitive advantage goes to organizations that implement this capability first. Your competitors still rely on retrospective dashboards and manual analysis. You'll spot opportunities and risks quarters before they do.
Start small. Pick one high-impact use case. Build the data foundations properly. Deploy simple analytics before complex models. Create tight feedback loops between predictions and outcomes.
The technical architecture matters less than organizational commitment. Your most significant challenges won't be building data pipelines or training models. They'll be changing how teams consume information, make decisions, and act on insights.
Get that right, and you transform your operations from reactive to predictive. Your business shifts from responding to problems to preventing them.
- Data strategy for AI adoption
- Building scalable data infrastructure
- The role of LLMs in enterprise automation
External Resources:
Want more on
Tech & AI?
Add this topic to your Custom Digest. Drop your email to get our deepest insights on this exact topic.
Ready to fast-track your business?
We combine enterprise-level technical strategy with your existing business to solve complex blockers and accelerate your growth. Let's build something remarkable.
Partner With UsUp Next
Continue your journey into Tech & AI.

Liberating marketing velocity from engineering queue dependencies
Learn how a semantic headless layer can free your marketing team from engineering bottlenecks and accelerate campaign deployment.
Eliminating manual data entry with automated CRM pipelines
Learn how content marketing builds trust, drives traffic, and converts customers. Proven strategies to grow your business the right way. Start today.
Liberating marketing velocity from engineering queue dependencies
Learn how a semantic headless layer removes engineering bottlenecks, giving your marketing team direct control over content and faster campaign launches.